.png)


Why Patient‑Centric Metrics Matter
The oncology landscape is moving from volume‑based reimbursement to value‑based care, and patient‑centric metrics are the linchpin of this transition. By capturing what matters most to patients—timeliness of treatment, shared decision‑making, symptom control, and overall satisfaction—clinicians can align care delivery with individual goals while meeting the Institute of Medicine’s six aims (patient‑centeredness, safety, effectiveness, efficiency, timeliness, equity). Evidence shows that navigation programs that reduce diagnosis‑to‑treatment intervals by 5–22 days and lower no‑show rates up to 20 % improve both clinical outcomes (e.g., higher treatment compliance, earlier adjuvant therapy) and financial sustainability (lower readmissions, higher ROI). Patient‑reported outcome measures such as the EORTC QLQ‑C30 and Net Promoter Score provide quantifiable data that correlate with adherence, lower emergency visits, and higher reimbursement under CMS Oncology Care Model and MACRA Quality Payment Program. Integrating these metrics into multidisciplinary pathways—supported by standardized frameworks like AONN+ and QOPI—creates a feedback loop that drives continuous improvement, enhances patient experience, and ultimately delivers high‑quality, cost‑effective oncology care.
Foundations of Oncology Evaluation
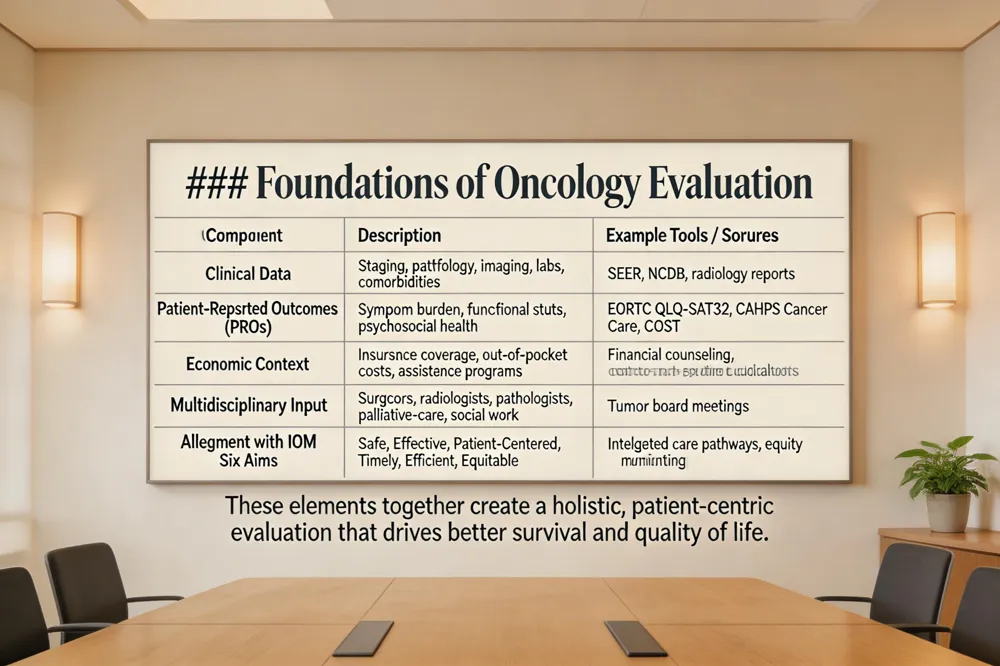 Oncology evaluation is a comprehensive, multidisciplinary assessment performed by an oncologist together with a care team to determine a patient’s cancer stage, overall health, and individualized treatment options. The process begins with a detailed review of the medical record, physical examination, imaging, pathology, and laboratory results to establish disease extent. Simultaneously, specialists such as surgeons, radiologists, pathologists, and palliative‑care physicians contribute their expertise, creating a coordinated treatment plan. Psychosocial factors—including mental health, social support, cultural preferences, and financial toxicity—are screened using validated tools such as the EORTC QLQ‑SAT32, CAHPS Cancer Care survey, and the COST instrument. Nutrition, functional status, and caregiver burden are also evaluated. Financial considerations, including insurance coverage, out‑of‑pocket costs, and potential assistance programs, are addressed to reduce barriers to care. By integrating clinical data, patient‑reported outcomes, and economic context, the evaluation aligns with the Institute of Medicine’s six aims (safe, effective, patient‑centered, timely, efficient, equitable) and supports evidence‑based, patient‑centric decision‑making. This holistic approach improves survival and quality of life.
The Eight Dimensions of Patient and Caregiver Experience
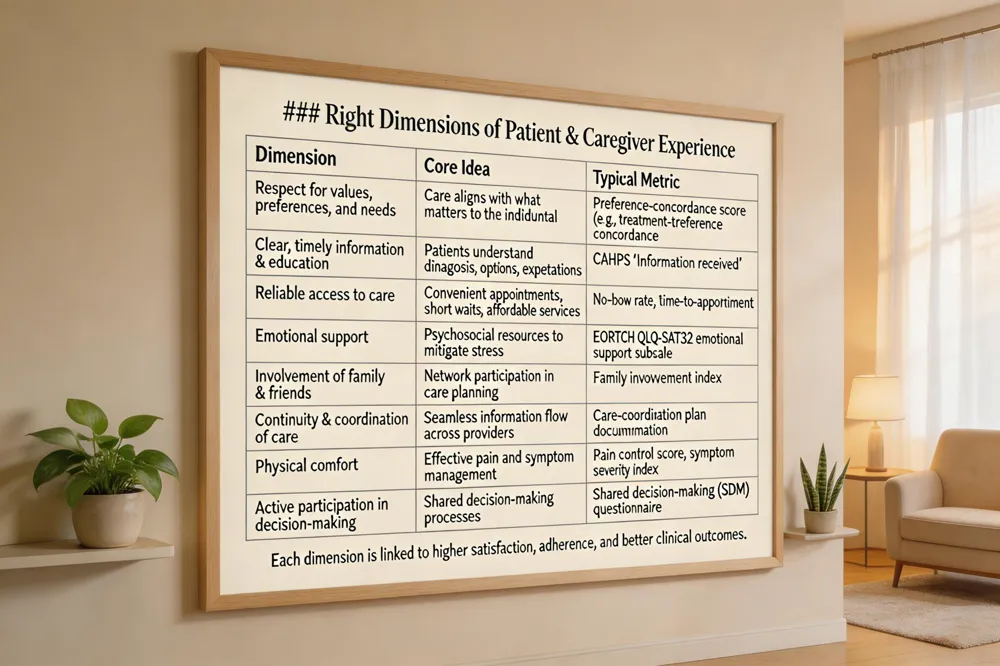 The Picker Institute identifies eight core dimensions that shape the patient‑and‑caregiver experience in oncology. 1) Respect for values, preferences, and needs – care plans align with what matters most to the individual. 2) Clear, timely information and education – patients understand diagnoses, options, and expectations. 3) Reliable access to care – convenient appointments, short wait times, and affordable services reduce barriers. 4) Emotional support – psychosocial resources mitigate stress. 5) Involvement of family and friends – a supportive network enhances coping. 6) Continuity and coordination of care – seamless information flow across providers prevents gaps. 7) Physical comfort – effective pain and symptom management creates a healing environment. 8) Active participation in decision‑making – shared decision‑making fosters ownership of treatment choices. Evidence from the Standardized Metrics Source Document, CAHPS Cancer Care Survey and navigation studies shows that each dimension contributes to higher patient satisfaction, better adherence, and improved outcomes such as reduced time to treatment initiation and lower readmission rates in U.S. cancer programs.
The Four P’s of Patient Experience
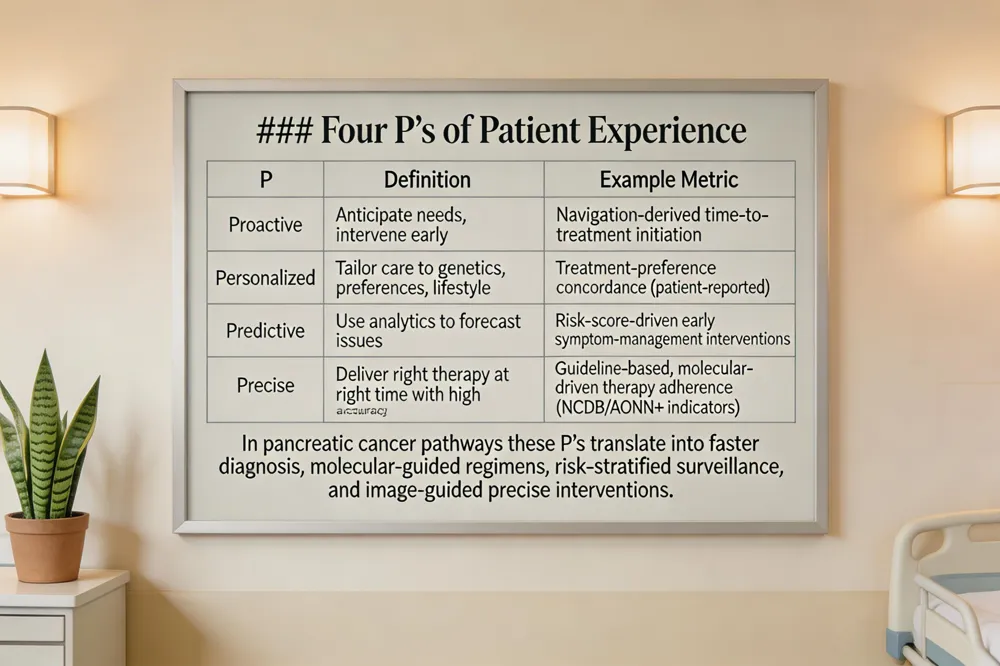 The four P’s of patient experience are proactive, personalized, predictive, and precise care. Proactive care anticipates health needs and intervenes early, reducing the chance of serious complications. Personalized care tailors treatment plans to each individual’s genetics, preferences, and lifestyle, ensuring relevance and adherence. Predictive care uses data analytics and risk modeling to forecast potential issues before they arise, enabling preventive actions. Precise care delivers the right therapy at the right time with maximal accuracy, often leveraging advanced technologies such as precision medicine and real‑time monitoring.
In pancreatic cancer pathways, these principles translate into early navigation that shortens diagnosis‑to‑treatment intervals (proactive), molecular‑guided regimen selection (personalized), risk‑stratified surveillance for treatment‑related toxicity (predictive), and image‑guided, minimally invasive surgery or targeted drug delivery (precise).
Metrics that capture each P include navigation‑derived time‑to‑treatment initiation (proactive), patient‑reported treatment‑preference concordance (personalized), predictive‑model risk scores linked to early symptom‑management interventions (predictive), and adherence to guideline‑based, molecular‑driven therapy protocols measured by NCDB or AONN+ quality indicators (precise).
Key Metrics for Measuring Cancer Burden
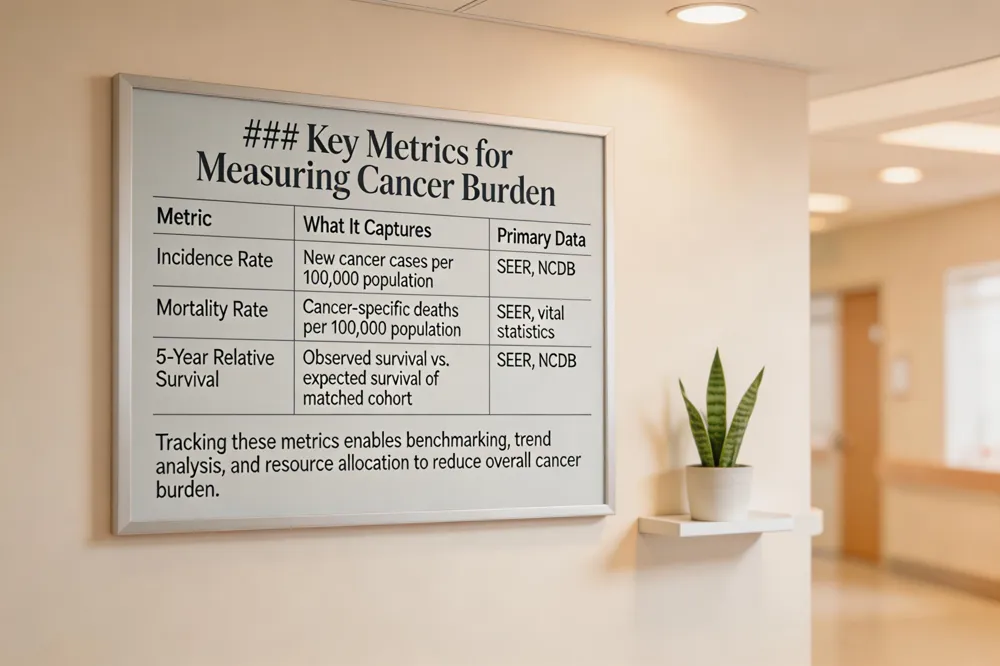 The two most critical metrics for gauging cancer burden are incidence and mortality rates and 5‑year relative survival. Incidence captures the number of new cancer cases in a defined population, while mortality reflects deaths attributable to cancer, together illustrating the disease’s impact on public health. Five‑year relative survival provides a standardized outcome measure that compares observed survival of cancer patients to expected survival of a comparable cancer group, allowing assessment of treatment effectiveness and progress over time. National cancer registries such as SEER (Surveillance, Epidemiology, and End Results) and the National Cancer Database (NCDB) systematically collect these data, enabling benchmarking across institutions, regions, and demographic groups. By tracking incidence, mortality, and 5‑year relative survival through SEER and NCDB, health systems can identify trends, evaluate the success of prevention and treatment initiatives, and allocate resources to reduce the overall cancer burden.
Five Dimensions of Patient‑Centered Care
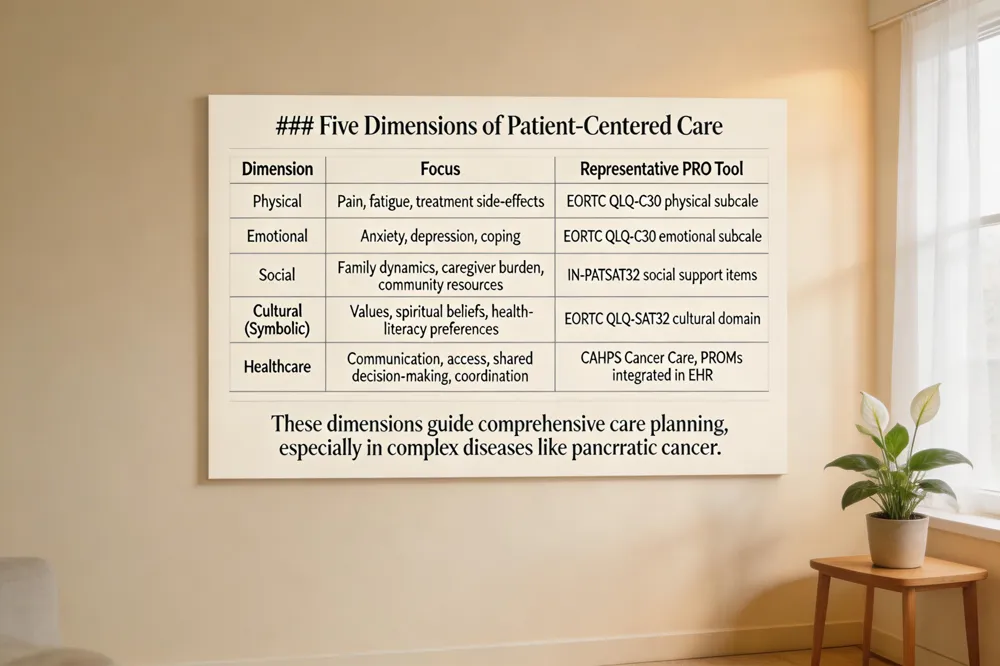 Patient‑centered care in oncology is built on five interlocking dimensions: (1) physical – managing pain, fatigue, and treatment side‑effects; (2) emotional – addressing anxiety, depression, and coping strategies; (3) social – supporting family dynamics, caregiver burden, and community resources; (4) cultural (symbolic) – honoring patients’ values, spiritual beliefs, and health‑literacy preferences; and (5) healthcare – ensuring clear communication, timely access, shared decision‑making, and coordinated multidisciplinary care.
In pancreatic cancer, these dimensions guide treatment planning by prompting early symptom control (physical), proactive counseling (emotional), caregiver education (social), culturally sensitive discussions of prognosis (cultural), and rapid multidisciplinary tumor board reviews to shorten the diagnosis‑to‑treatment interval (healthcare).
Patient‑reported outcome tools such as the EORTC QLQ‑C30, PAN‑26, and IN‑PATSAT32 capture data across all five dimensions, allowing clinicians to translate patient voice into measurable quality improvement.
Standardized Navigation Metrics and Their Impact
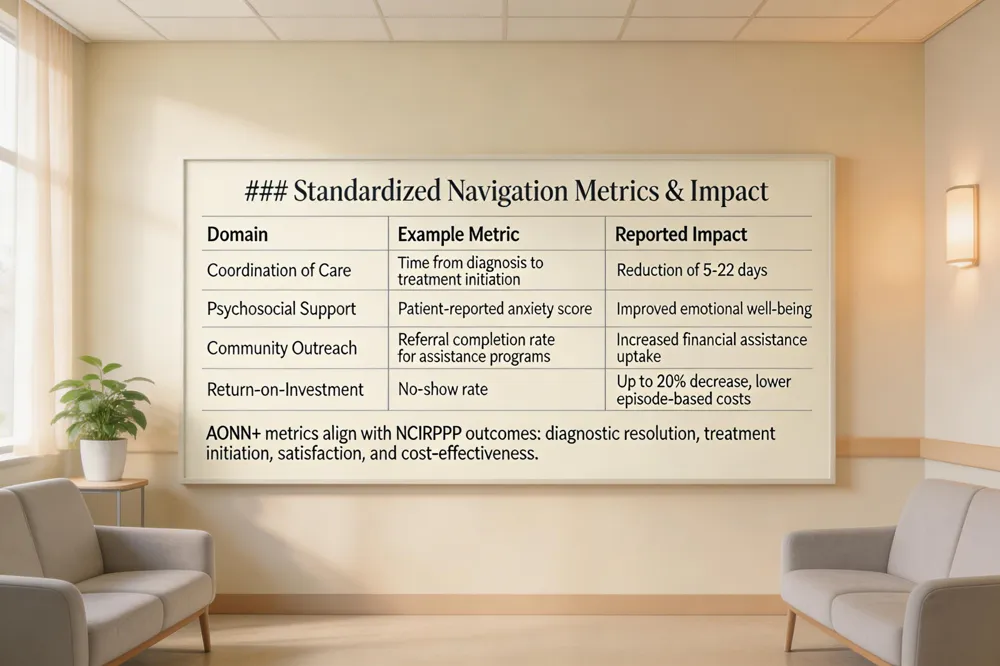 The AONN+ initiative defines 35 baseline navigation metrics that span patient experience, clinical outcomes, and return‑on‑investment across domains such as Coordination of Care, Psychosocial Support, and Community Outreach. National evidence shows that applying these standardized measures reduces the time from cancer diagnosis to treatment initiation by 5–22 days, with patient navigation programs achieving up to a 20 % drop in no‑show rates. These timeliness gains translate into measurable ROI: faster diagnostic resolution shortens episode‑based costs, while higher appointment adherence lowers wasteful revenue and improves reimbursement under CMS’s Oncology Care Model. Moreover, the AONN+ metrics align with the National Cancer Institute Patient Navigation Research Program’s four primary outcomes—diagnostic resolution, treatment initiation, patient satisfaction, and cost‑effectiveness—demonstrating that a coordinated, metric‑driven navigation framework can simultaneously enhance clinical efficiency, patient experience, and financial performance for U.S. oncology programs.
Clinical Quality Measures and the IOM Six Aims
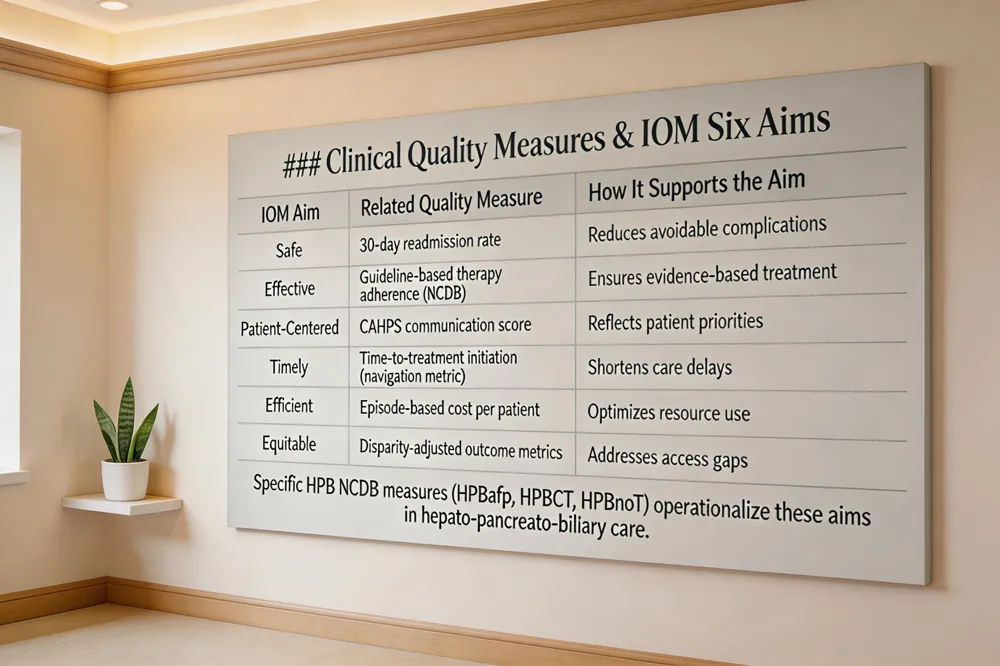 The Institute of Medicine’s six aims—safe, effective, patient‑centered, timely, efficient, and equitable— provide a framework for evaluating oncology care. CMS’s Oncology Care Model (OCM) operationalizes these aims by linking reimbursement to performance on both clinical and patient‑experience metrics, such as 30‑day readmission rates, emergency department utilization, and documented care‑coordination plans. Parallel to OCM, the National Cancer Database (NCDB) supplies disease‑specific quality indicators that support the IOM goals; for example, the NCDB tracks adherence to guideline‑based therapies and surgical quality across cancer types. In the hepato‑pancreato‑biliary (HPB) domain, three new NCDB measures illustrate this alignment: HPBafp mandates alpha‑fetoprotein testing at diagnosis for hepatocellular carcinoma, HPBCT requires initiation of adjuvant chemotherapy within 180 days after curative surgery for stage I/II cholangiocarcinoma or pancreatic ductal adenocarcinoma, and HPBnoT records R0 resection status, confirming no residual tumor. Together, these metrics ensure that care is safe, evidence‑based, patient‑focused, promptly delivered, resource‑efficient, and accessible to all populations.
Patient‑Reported Outcomes and Satisfaction Tools
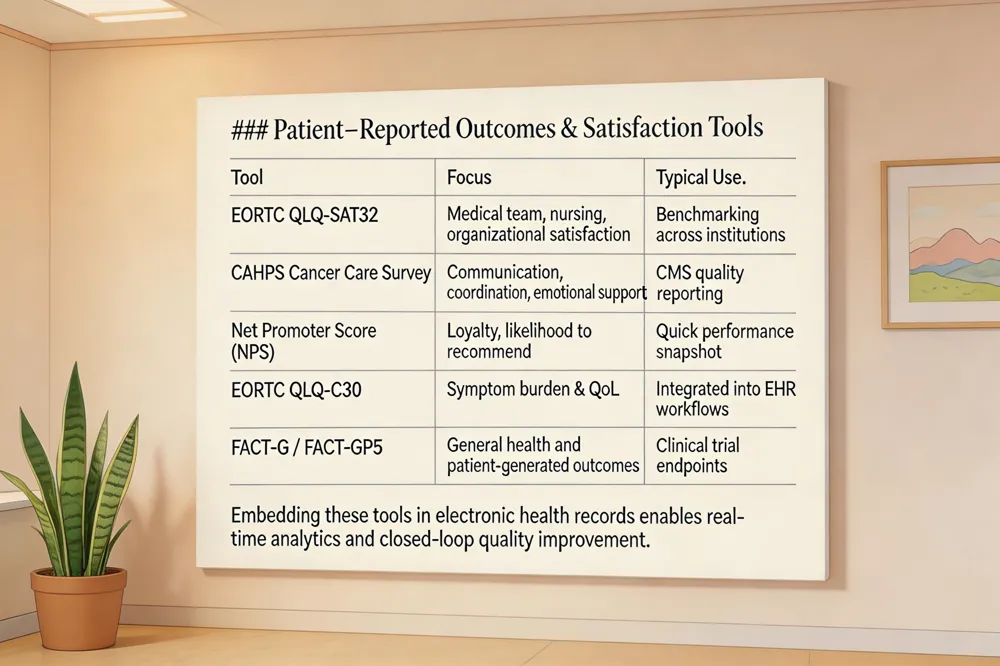 Standardized satisfaction instruments such as the EORTC QLQ‑SAT32, the CAHPS Cancer Care Survey, and the Net Promoter Score (NPS) provide a common language for capturing the patient’s view of oncology care. The EORTC QLQ‑SAT32 evaluates medical‑team, nursing‑team, and organizational domains, while CAHPS focuses on communication, coordination, and emotional support. NPS adds a single‑item measure of loyalty that benchmarks performance against industry norms. To move beyond static surveys, many centers embed the EORTC QLQ‑C30 and FACT‑G (or FACT‑GP5) into electronic health‑record (EHR) workflows, allowing patients to complete PROs on tablets or portals before visits. Real‑time analytics then flag declines in symptom control or QoL, triggering immediate outreach. Closed‑loop quality‑improvement cycles—often using six‑sigma or Lean methods—turn these data into actionable changes, such as adjusting pain‑management plans or enhancing education modules. By integrating PROMs into the EHR and establishing rapid feedback loops, oncology programs can align clinical processes with what truly matters to patients, driving higher satisfaction, better adherence, and ultimately, improved outcomes.
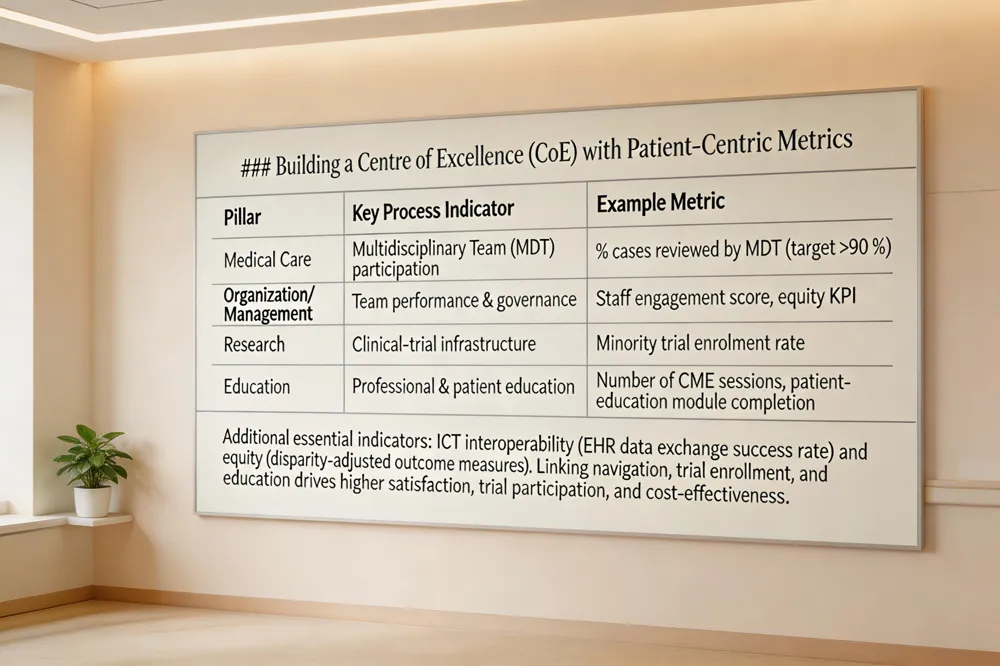
Building a Centre of Excellence with Patient‑Centric Metrics
Four Pillars of a Cancer Centre of Excellence
A Centre of Excellence (CoE) integrates medical care, organization/management, research, and education. Medical care demands specialised treatments, multidisciplinary team (MDT) participation and state‑of‑the‑art equipment. Organization/management focuses on high‑performance teams, career‑development policies, and governance frameworks. Research criteria include international collaboration, robust clinical‑trial infrastructure, and translational science. Education encompasses residency/fellowship programmes, continuous professional development, and patient‑education initiatives.
Key Process Indicators: MDT, ICT, and Equity
multidisciplinary team (MDT) participation—cited in 10 of 20 reviewed papers—is essential for coordinated treatment planning and has been shown to reduce time‑to‑treatment by up to 30%. ICT interoperability enables seamless referrals, real‑time data capture, and big‑data analytics for quality improvement. Notably, current CoE frameworks often omit health‑equity and governance metrics, creating a gap that must be addressed through inclusive data collection and disparity‑focused performance goals.
Linking Navigation, Clinical Trials, and Education to Outcomes
Patient navigation (AONN+ metrics) shortens diagnosis‑to‑treatment intervals by 5‑22 days, lowers no‑show rates up to 20%, and improves minority trial enrolment. Coupling navigation with robust clinical‑trial education and multidisciplinary outreach translates into measurable gains: higher patient‑satisfaction scores (e.g., CAHPS Cancer Care), increased trial participation, and improved cost‑effectiveness—all core to a patient‑centric CoE.
Driving Future Excellence
Hirschfeld Oncology will continuously refine patient‑centric metrics by expanding the AONN+ navigation set, integrating validated tools such as the CAHPS Cancer Care Survey, EORTC QLQ‑SAT32 and PROMs (e.g., EORTC QLQ‑C30, FACT‑GP5). Real‑time EHR analytics will track time‑to‑diagnosis, time‑to‑treatment, no‑show rates, and 30‑day readmissions, enabling rapid cycle improvement and risk‑adjusted reporting. Data from national registries (NCDB, SEER) and CMS Oncology Care Model benchmarks will be merged with internal dashboards to align performance with the Institute of Medicine’s six aims—particularly timeliness, safety, and equity. This evidence‑based approach supports value‑based reimbursement by demonstrating pathway compliance, cost‑effectiveness, and ROI on navigation services. ultaneously, the multidisciplinary team will uphold a compassionate, science‑driven pancreatic cancer program: personalized treatment plans, early clinical‑trial enrollment, integrated supportive services, and continuous patient education. By marrying rigorous metric stewardship with patient‑focused care, Hirschfeld Oncology will advance both clinical outcomes and patient experience, setting a new standard for oncology service excellence.
.png)
.png)