.png)


A family member forwards you an article about a new cancer drug. The headline says it cuts risk by 50%. That sounds enormous. It also raises the question most patients ask next, often with a mix of hope and caution: What does that mean for me?
That question matters even more in advanced cancer care, where decisions are rarely abstract. You may be weighing a treatment against fatigue, neuropathy, clinic time, travel, cost, or the simple wish to feel well enough for daily life. A dramatic statistic can sound like a clear answer when it’s really only part of the story.
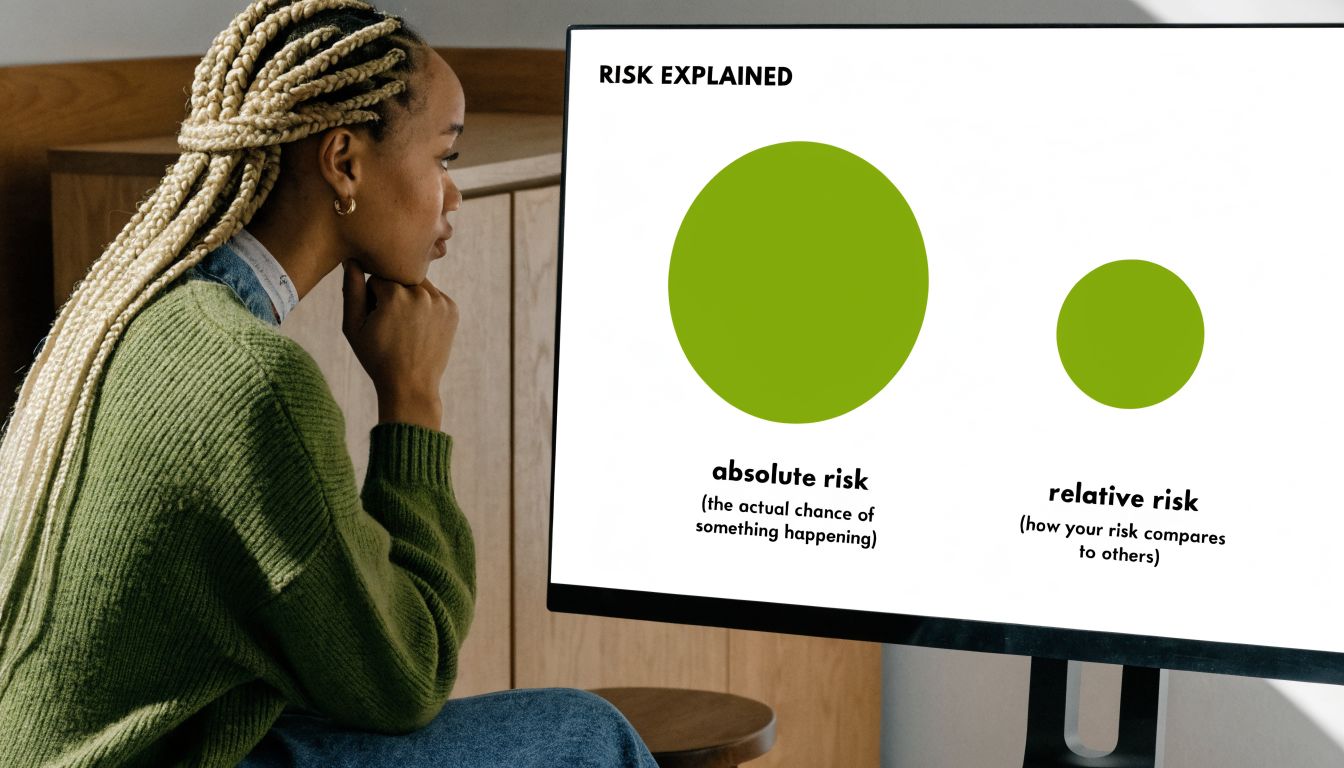
The difference usually comes down to two ways of describing benefit: absolute risk and relative risk. Both are real. Both are useful. But they answer different questions, and when they’re presented without context, they can leave patients and families confused or overly optimistic.
Here’s the short version. Absolute risk tells you the actual chance that something happens. Relative risk tells you how one group compares with another. If you understand that distinction, you’re in a much stronger position to make sense of study results, news reports, and treatment recommendations.
Making Sense of Cancer Treatment Statistics
A patient in my office might say, “I read that this treatment lowers recurrence by half. Shouldn’t I take it?” That reaction is completely understandable. Most of us hear “half” and think the benefit must be large.
But cancer statistics often compress a complicated reality into one striking phrase. A relative reduction can sound dramatic even when the actual difference for a patient is modest. In advanced cancers such as pancreatic or bile duct cancer, that distinction can shape very personal choices about treatment intensity, side effects, and quality of life.
Early in a cancer journey, many people assume numbers should make decisions easier. In practice, numbers can create a second layer of uncertainty. Patients aren’t only asking whether a treatment works. They’re asking whether the likely benefit is large enough to justify what the treatment asks of them.
Here’s a simple comparison that helps:
| Measure | What it tells you | Best question it answers | Why it can confuse people |
|---|---|---|---|
| Absolute risk | The actual chance of an outcome | “What is the chance this happens?” | It may sound small even when it matters |
| Relative risk | How risk compares between two groups | “How much lower or higher is risk with treatment?” | It can sound larger than the real-world benefit |
| Absolute risk reduction | The actual difference made by treatment | “How many people are helped?” | It gets less attention in headlines |
| Relative risk reduction | The proportional decrease in risk | “How much was risk cut compared with the starting point?” | It often sounds more impressive than ARR |
Patients and families don’t need a statistics degree to understand these ideas. They need clear language, honest framing, and a chance to ask, “How does this apply to my situation?”
The most useful cancer statistic is rarely the most dramatic one. It’s the one that helps you decide.
Once you start looking for baseline risk, absolute benefit, and the possibility of side effects, many confusing claims become much easier to interpret. That doesn’t eliminate uncertainty. It does make the uncertainty more manageable, and that’s often what good decision-making looks like in oncology.
Defining Absolute Risk and Relative Risk
Absolute risk is the simplest place to start. It means the actual chance that an event happens in a group over a given period. If you want an everyday analogy, think of a weather forecast. If rain is expected on 20 out of 100 similar days, the absolute risk of rain is 20%. It answers the plain-language question: What is the chance of this outcome?
Relative risk is different. It compares the risk in one group with the risk in another group. Instead of telling you the chance by itself, it tells you how risks relate. It answers a comparison question: How much more likely or less likely is the event in one group than another?
A plain-language analogy
Suppose one neighborhood has a small chance of power outage during a storm, and another neighborhood has an even smaller chance. If the second neighborhood’s risk is half the first, that’s a relative comparison. But if the actual difference is only a few outages in a large group, the practical meaning may feel very different from the phrase “half the risk.”
That’s where people often get tripped up. Relative risk is not false or misleading by itself. The problem appears when it’s presented alone.
A concrete example
A useful illustration comes from the Institute for Work & Health’s explanation of absolute and relative risk. In factory A, 20 out of 100 workers (20%) had back pain. In factory B, 30 out of 150 workers (20%) had back pain. The group sizes differ, but the absolute risk is the same at 20% in both factories.
That means the relative risk is 1, which tells us there’s no difference between the groups.
Now the story changes after an intervention in factory A. Back pain falls from 20 out of 100 to 8 out of 100, so the new absolute risk is 8%. The absolute risk reduction is 12 percentage points, from 20% to 8%. At the same time, the relative risk becomes 0.40, which corresponds to a relative risk reduction of 60%.
Both descriptions are mathematically correct. But they feel different.
- Absolute view: 12 fewer workers out of 100 had back pain.
- Relative view: risk was reduced by 60%.
The second phrasing sounds bigger. The first phrasing feels more grounded in what happened.
A short video can help if you prefer to see the idea explained visually.
Why this matters in cancer care
In oncology, families often hear language like “reduced recurrence,” “lowered progression risk,” or “improved survival.” Those statements may use relative risk because it’s compact and attention-grabbing. But a patient deciding whether to start treatment usually needs the absolute version too.
Practical rule: When you hear a relative claim, ask for the starting risk and the ending risk.
That one habit can transform your understanding. If the baseline risk is high, a treatment may deliver meaningful absolute benefit. If the baseline risk is low, the same relative reduction may translate into a much smaller real-world gain.
This is why absolute risk vs relative risk isn’t just a statistics lesson. It’s part of informed consent, realistic hope, and shared decision-making.
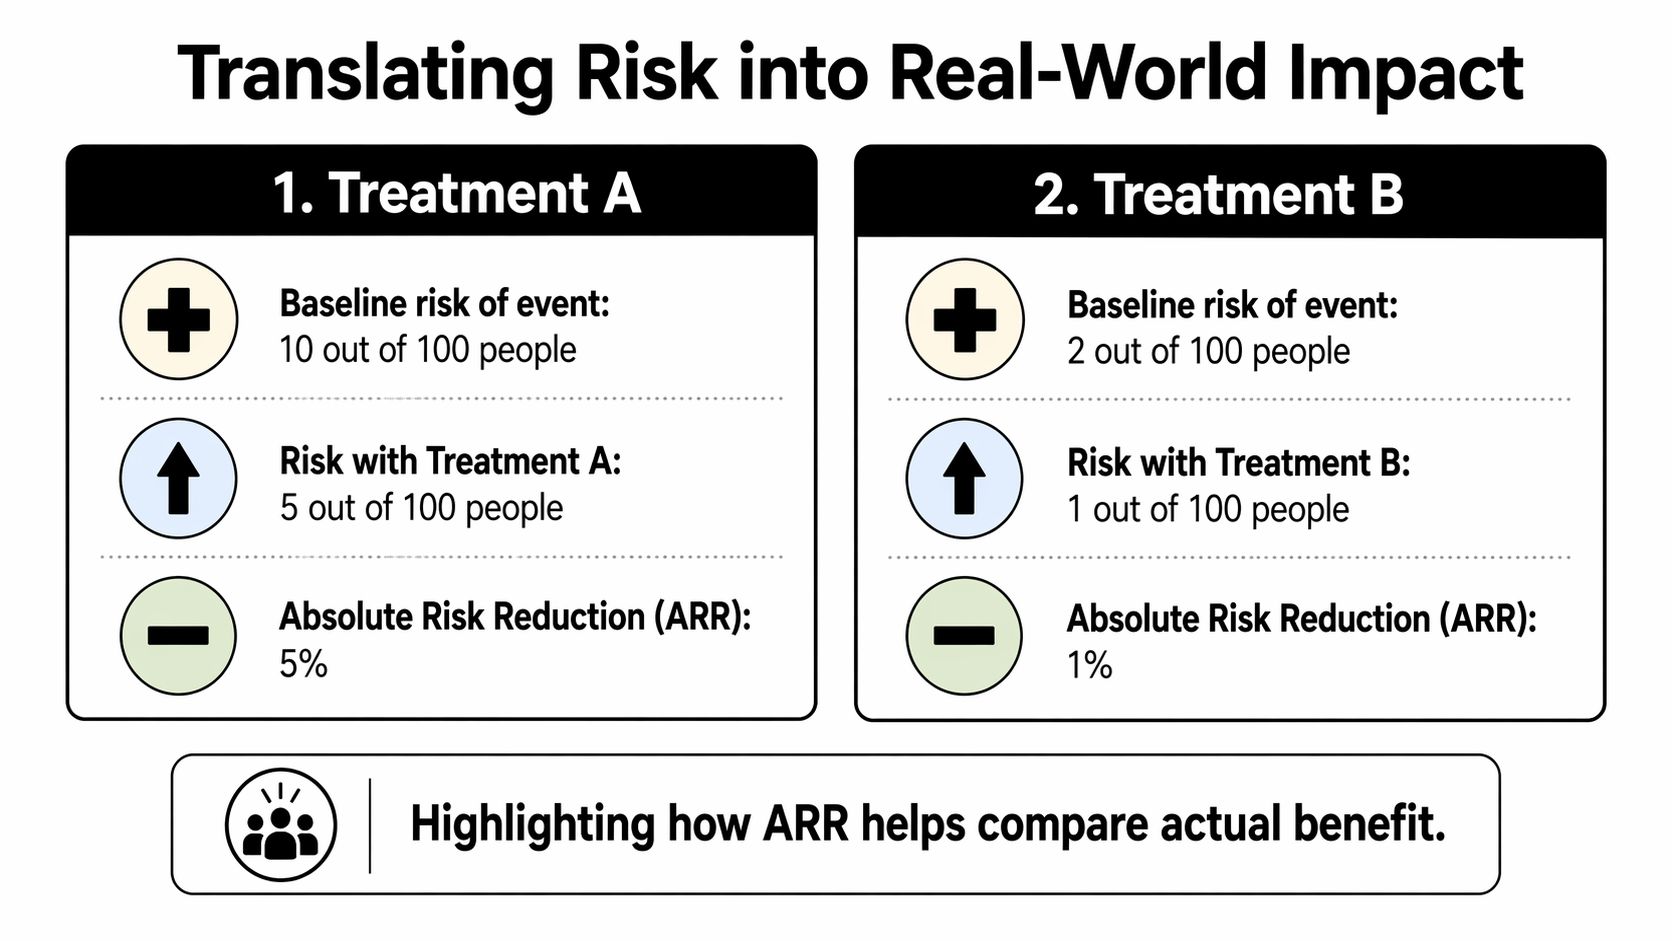
Translating Risk into Real-World Impact
Definitions are useful, but decisions usually depend on three related ideas: absolute risk reduction, relative risk reduction, and number needed to treat. These help turn a study result into something a patient can picture.
ARR and RRR in one clinical example
A classic teaching example described in the NCBI Bookshelf chapter on understanding treatment effects looks at a treatment that lowers the chance of a poor outcome in children. Without treatment, the risk is 20%. With treatment, it falls to 12%.
From that single example, you can calculate several different measures:
| Calculation | Result | Meaning |
|---|---|---|
| Absolute risk without treatment | 20% | 20 out of 100 children have the poor outcome |
| Absolute risk with treatment | 12% | 12 out of 100 children have the poor outcome |
| Absolute risk reduction (ARR) | 8 percentage points | 8 fewer children out of 100 have the poor outcome |
| Relative risk (RR) | 0.60 | The treated group has 60% of the original risk |
| Relative risk reduction (RRR) | 40% | Risk is reduced by 40% relative to the starting point |
| Number needed to treat (NNT) | 12.5 | About 12.5 children need treatment for one to benefit |
The same data can sound very different depending on which number gets highlighted.
What ARR really tells you
Absolute risk reduction, or ARR, is the actual subtraction:
20% - 12% = 8%
That means for every 100 people treated, 8 avoid the bad outcome. ARR is often the most intuitive way to understand how many people are helped in real life.
Why RRR sounds larger
Relative risk reduction, or RRR, compares the size of the drop to the original risk:
(20% - 12%) / 20% = 40%
That’s accurate. But it doesn’t tell you how common the event was to begin with. If someone hears only “40% reduction,” they may imagine a larger practical effect than the data support.
This is one reason medical headlines often mislead without technically lying. They choose the framing that sounds strongest.
The Number Needed to Treat
Now for the measure many clinicians find most useful in conversation: Number Needed to Treat, or NNT.
NNT asks a very human question:
If a group of people like me takes this treatment, how many need to receive it for one person to benefit?
In the example above, the NNT is 12.5, based on the source cited above. That means about 12.5 children need treatment for one child to avoid the poor outcome.
This doesn’t mean the treatment “fails” in everyone else. It means that in a group, only one person gains that particular measured benefit because of the treatment during the study period. Others may do well anyway, may not have had the event regardless, or may have outcomes the trial didn’t measure.
Why NNT helps with cancer decisions
NNT makes treatment benefit easier to compare with burdens such as:
- Toxicity burden when a drug causes fatigue, nausea, neuropathy, rash, or low blood counts.
- Time cost from infusions, scans, blood work, travel, and recovery days.
- Goal alignment when a patient values symptom control more than a small statistical chance of delaying progression.
A related term is Number Needed to Harm, often shortened to NNH. It asks how many people must receive a treatment before one person experiences a harmful effect. I’m not giving a numeric example here because that depends on the specific treatment and study. But conceptually, this is the balance patients deserve to hear: How many are helped, and how many are harmed?
The key question behind the math
A treatment can have a strong-looking relative effect and still offer a modest absolute benefit. That doesn’t mean it isn’t worth using. It means the decision has to include your goals, your baseline risk, and how much treatment burden you’re willing to accept.
For many families, that’s the turning point. Statistics stop being abstract and start becoming part of a values-based decision.
How to Interpret Oncology Study Results
Cancer studies often report results in language that sounds precise but can still be hard to interpret. Two terms cause confusion more than most: hazard ratio and confidence interval.
Confidence intervals first
A confidence interval, often written as 95% CI, tells you the range of values that are compatible with the study data. It helps answer a practical question: How precise is this estimate?
According to the explanation summarized in this video on confidence intervals and risk interpretation, a relative risk is considered statistically significant when the 95% confidence interval excludes 1.0. For example, RR 0.8 with 95% CI 0.6 to 0.95 suggests a statistically significant reduction in risk because the interval stays below 1.0.
For an absolute risk difference, the rule is different. Its confidence interval needs to exclude 0 to be statistically significant.

Statistical significance isn’t the same as clinical importance
This distinction matters. A study can show a statistically significant relative risk change and still leave an important clinical question unanswered: Is the actual benefit large enough to matter to a patient?
That’s why a result can be technically positive and still feel underwhelming in practice. If the baseline event rate is low, or if the confidence interval around the absolute difference is wide, the practical value may be limited even when the relative measure looks impressive.
A statistically significant number can still describe a small real-world benefit.
What about hazard ratios
Cancer trials often use hazard ratios for time-to-event outcomes such as progression-free survival or overall survival. The basic idea is similar to relative risk, but it reflects risk over time rather than a single fixed point.
Patients don’t need to master the statistical mechanics. They do need one simple reading rule: a hazard ratio below 1 generally favors the treatment, and the confidence interval should stay below 1 for the result to look statistically convincing. If you’re new to how trials are designed, this overview of clinical trial phases can help place those study results in context.
Red flags to watch for
When you read a study summary, article, or press release, slow down if you see any of these patterns:
- Big relative claim, no baseline risk. “Risk reduced by 50%” means very little if you don’t know the starting risk.
- No absolute difference. If the report never tells you how many people were helped, you’re missing a key part of the picture.
- Confidence interval issues. If the interval crosses the threshold for significance, the result is less certain.
- Surrogate framing only. A treatment might improve a scan-based or lab-based measure without clearly improving the outcome the patient cares most about.
A useful script for reading results
Try reading any oncology result this way:
- What was the risk before treatment?
- What was the risk after treatment?
- What is the absolute difference?
- How precise is that estimate?
- Does that difference matter enough for me, given side effects and goals?
That approach turns a dense paper into a conversation you can use.
Risk in Context for Advanced Cancer Care
In advanced cancer, numbers land differently. A person with metastatic disease usually isn’t evaluating a treatment in a vacuum. They’re considering symptoms, prior treatments, cumulative toxicity, family responsibilities, and what they most want from the next stretch of care.
That’s why absolute risk vs relative risk matters so much in later-line oncology. A relative number may sound hopeful, but a patient often needs to know whether the actual benefit is likely to be meaningful in daily life.
Why this issue is sharper in treatment-resistant disease
In pancreatic, bile duct, colorectal, gastric, ovarian, and esophageal cancers, treatment decisions often come after prior therapies have already taken a physical and emotional toll. A new option may be promising, but “promising” can mean different things depending on whether the benefit is substantial for a group or modest for most with meaningful benefit for a smaller subset.
Families commonly hear statements such as “this drug improved outcomes” or “this regimen reduced progression risk.” Those phrases may be true, but they don’t answer the bedside question: What are the chances this helps someone in my exact situation enough to justify treatment?

Small absolute benefit can still matter
This is an important point. A small absolute benefit is not automatically unimportant.
For one patient, a modest chance of response may be worth significant effort because they want to pursue every active option. Another patient may place greater value on fewer clinic visits, less toxicity, better symptom control, or time at home. Neither approach is wrong.
In advanced cancer care, the same statistics can support different decisions because patients have different priorities.
Questions that bring risk into focus
When facing a treatment choice, these questions often clarify more than the headline statistic:
- What is my baseline risk without this treatment? Your oncologist may estimate this from the disease setting, prior response, performance status, and biomarker profile.
- What is the absolute benefit, not just the relative benefit? This keeps the discussion grounded.
- How likely am I to experience side effects that change daily function? A modest benefit may feel very different if toxicity is mild versus disruptive.
- Is there a biomarker or tumor feature that makes benefit more or less likely? Biomarker-driven care is increasingly important. This guide to cancer biomarkers explains why.
- What outcome matters most here? Tumor shrinkage, symptom relief, progression delay, and overall survival are not interchangeable.
In advanced disease, the right treatment isn’t always the one with the largest-looking statistic. It’s the one that best fits the patient’s goals and tolerance for burden.
Personalization is the future, but the principle is already here
Even before formal prediction tools enter routine use, good oncology care already moves beyond population averages. Oncologists personalize risk by considering disease biology, prior treatment history, organ function, frailty, symptoms, and patient preferences.
That matters because a population average can blur major differences between individuals. Two patients with the same cancer type may have very different likely benefit from the same treatment. One may have a biomarker that makes response more plausible. Another may face a higher chance of treatment complications. The “average” trial result belongs to neither patient perfectly.
Families often feel the tension most acutely. They want data, but they also want honesty about uncertainty. They want hope, but not inflated hope. They want options, but not options stripped of context.
A practical way to frame the decision
For advanced-stage cancers, I often think the most useful conversation has three parts:
| Decision lens | What to ask | Why it matters |
|---|---|---|
| Potential benefit | What is the absolute chance this helps me? | Keeps benefit concrete |
| Potential burden | What side effects or disruptions are most likely to matter day to day? | Protects quality of life |
| Personal goals | Does this option fit what I want most right now? | Aligns treatment with values |
That frame is especially helpful when considering less toxic strategies, targeted approaches, or immunotherapy after standard options have been exhausted. The key is not whether a treatment sounds impressive in a press release. The key is whether the likely upside is meaningful for this patient, at this time.
Empowering Your Care Conversations
Understanding the numbers is useful. Using them in a real appointment is what changes care.
Patients often hesitate to ask detailed questions because they don’t want to seem difficult, ungrateful, or confrontational. Please don’t worry about that. Thoughtful questions usually make the conversation better. They help your oncology team explain the reasoning behind a recommendation and tailor the discussion to what matters most to you.
Questions patients should ask
Bring a written list. That reduces stress and helps families remember what was said.
- Ask for the baseline risk. “What is the risk of this outcome if I don’t take this treatment?”
- Ask for the absolute benefit. “What is the absolute risk reduction for someone in my situation?”
- Ask for the comparison number too. “What is the relative risk reduction, and how is it different from the absolute number?”
- Ask about group meaning. “How many patients need to take this treatment for one person to benefit?”
- Ask about harms in the same format. “How often do side effects serious enough to affect daily life happen?”
- Ask for a personalized interpretation. “Based on my cancer, prior treatments, and general condition, do you think I’m closer to the average patient in the study, or am I meaningfully different?”
- Ask what outcome is being improved. “Are we talking about tumor shrinkage, symptom relief, delaying progression, or helping people live longer?”
- Ask what happens if you wait or choose differently. “What is the trade-off if I don’t start this now?”
If you want a structured list to take into a visit, this guide on questions to ask your oncologist can help organize the discussion.
Communication tips for clinicians
Clear risk communication is part of good oncology care. It reduces regret and supports trust.
- Lead with absolute risk. Start with the actual chance of benefit before the relative comparison.
- Use frequencies, not just percentages. Many patients understand “8 out of 100” better than “8%.”
- Pair benefit with burden. Discuss likely gains and likely side effects in the same conversation.
- State the uncertainty plainly. Patients can handle uncertainty better than vague reassurance.
- Use visual aids when possible. Simple charts, tables, and written summaries help families process information after the visit.
- Check understanding. Ask the patient to explain back what they heard. That often reveals where confusion remains.
Good risk communication doesn’t remove hard choices. It makes those choices more honest and more humane.
Shared decision-making works best when the language is clear, the numbers are grounded, and the recommendation connects directly to the patient’s goals.
Frequently Asked Questions About Cancer Risk Statistics
Why do news reports often use relative risk?
Because it usually sounds larger and more dramatic. A headline that says a treatment “reduced risk by 40%” tends to grab more attention than one that describes the absolute difference. That doesn’t mean the number is wrong. It means it may be incomplete.
Is a small absolute benefit ever worth it?
Yes. It can be, depending on the setting, the toxicity, and what the patient wants. In advanced cancer, some patients will accept a modest chance of benefit for an option that offers hope or symptom relief. Others won’t. The right answer depends on values, not just arithmetic.
Is statistically significant the same as clinically important?
No. A statistically significant result means the finding is less likely to be due to chance, based on the study’s analysis. It does not automatically mean the benefit is large enough to matter in day-to-day life.
Which number should I pay the most attention to?
Start with absolute risk and absolute risk reduction. Then look at the relative number for context. If possible, also ask about number needed to treat and side effect risk.
If a treatment has a good relative risk reduction, should I feel reassured?
Only partly. You still need to know the baseline risk, the absolute benefit, and the treatment burden. Relative reductions are most meaningful when they’re paired with those other details.
What’s the simplest takeaway from absolute risk vs relative risk?
Ask two questions every time: Compared with what? and By how much in actual terms? Those two questions cut through a lot of confusion.
If you or a loved one is trying to make sense of complicated treatment statistics, Hirschfeld Oncology offers patient-centered guidance on advanced cancer care, treatment options, and the questions that help families make clearer decisions.
.png)
.png)